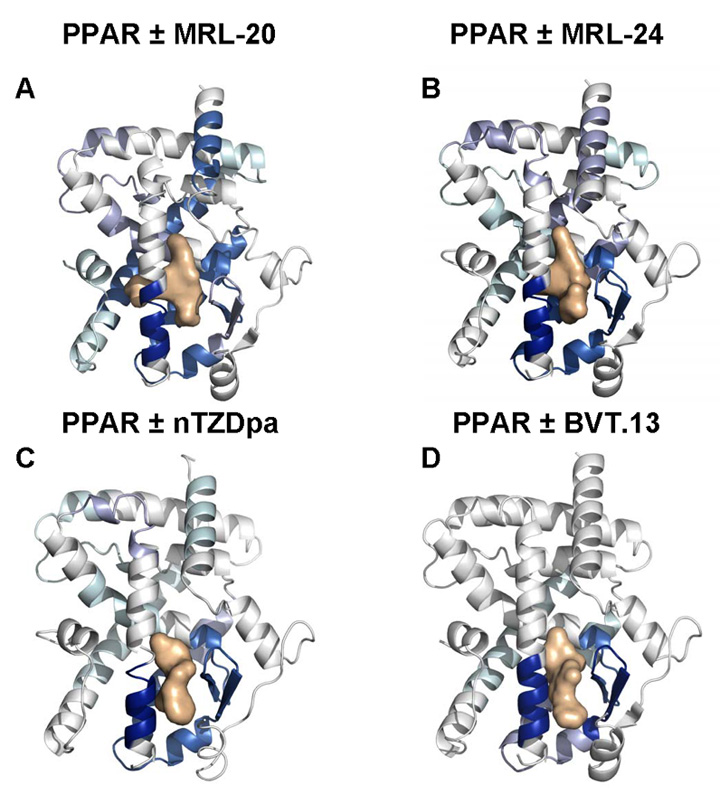
Ribbon diagram of PPARγ LBD overlaid with the differential H/D exchange data. The magnitude of the reduction in H/D exchange rate following ligand binding is represented according to the color key. Ligand density is displayed as a surface representation; PPARgamma (A) MRL-20, (B) MRL-24, (C) nTZDpa, and (D) BVT.13.