Primary Fibroblast Rhythms Sorted by Start Phase
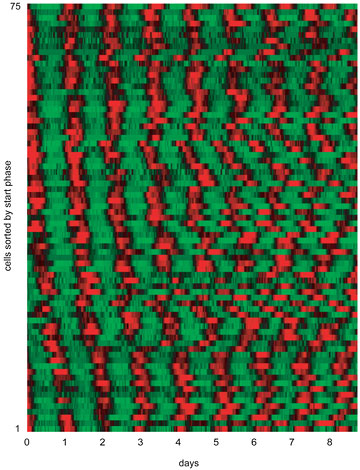
Luminescence rhythms of all 75 primary fibroblasts from one experiment are represented in this plot. Each horizontal raster line represents a single cell, with elapsed time plotted left to right. Luminescence intensity data from all cells were normalized for amplitude, and then color-coded: higher than average values are red, and lower than average values are green. The cells are sorted in order of start phase, so that the emergence of desynchrony can be more easily appreciated. Image from Welsh et al. Courtesy of Current Biology.